Overview of Week 4 - How might I apply learning analytics? Should I?
Table of Contents
- Overview of Week 4
- Experiencing - Example learning analytics
- Examining - Your experience with learning analytics: As teacher and student
- Explaining - What is learning analytics and what might it be good for?
- Applying - How might I apply learning analytics? Should I?
1. Where are we?
Last week’s learning path introduced the idea of emerging practice. It also looked at one of the emerging practices associated with teacher inquiry into student learning identified by Emin-Martinez et al (2014) - learning design. This week’s learning path examines the other example of emerging practice identified by Emin-Martinez et al (2014) - learning analytics.
Learning analytics can potentially play an important part of your work on a number of assignment components, especially Assignment 1, Part B (the next two weeks will focus on Part B for assignment 1 more). This week the focus is on you answering this week’s driving question for your discipline and context
How might I apply learning analytics? Should I?
2. This week's learning path
This week's learning path consists of the following four sections.
Experiencing
Asks you to watch and read about a small collection of examples of how learning analytics has been used by tertiary educators.
This includes:
Examining
Asks you to reflect on the examples of learning analytics and their applicability to your discipline and context.
This includes:
Explaining
Asks you to read literature that explains how learning analytics is linked to teacher inquiry into student learning, and offers an abstract conceptualisation of learning analytics and its implications for learning and assessment.
This includes:
-
1 Moodle book with 11 pages.
-
Possibly revising almost 2 pages from Mor et al (2015).
-
Reading 8 pages from Cope and Kalantzis (2016)
-
Mapping learning analytics against the TISL process and this course.
Applying
Asks you to draw upon the abstract conceptualisations of learning analytics and your previous efforts in understanding the assumptions of teaching in your discipline and context to answer this week’s driving questions
How might I apply learning analytics? Should I?
This includes:
3. This week’s references
boyd, danah, & Crawford, K. (2012). Critical questions for big data. Information, Communication & Society, 15(5), 662–679. https://doi.org/10.1080/1369118X.2012.678878
To read 8 pages. Cope, B., & Kalantzis, M. (2016). Big Data Comes to School: Implications for Learning, Assessment, and Research. AERA Open, 2(2), 2332858416641907. https://doi.org/10.1177/2332858416641907
Emin-martínez, V., Hansen, C., Rodriguez-Triana, M. J., Wasson, B., Mor, Y., Dascalu, M., … Pernin, J.-P. (2014). Towards teacher-led design inquiry of learning. eLearning Papers, (January), 1–12.
Gašević, D., Dawson, S., Rogers, T., & Gasevic, D. (2015). Learning analytics should not promote one size fits all: The effects of instructional conditions in predicating learning success. The Internet and Higher Education, 28, 68–84. https://doi.org/10.1016/j.iheduc.2015.10.002
Jones, D., & Clark, D. (2014). Breaking BAD to bridge the reality/rhetoric chasm. In B. Hegarty, J. McDonald, & S. Loke (Eds.), Rhetoric and Reality: Critical perspectives on educational technology. Proceedings ascilite Dunedin 2014 (pp. 262–272).
Kop, R., Fournier, H., & Durand, G. (2017). A Critical Perspective on Learning Analytics and Educational Data Mining. In C. Lang, G. Siemens, A. F. Wise, & D. Gaševic (Eds.), The Handbook of Learning Analytics (1st ed., pp. 319–326). Alberta, Canada: Society for Learning Analytics Research (SoLAR). Retrieved from http://solaresearch.org/hla-17/hla17-chapter1
Lodge, J., & Lewis, M. (2012). Pigeon pecks and mouse clicks : Putting the learning back into learning analytics. In M. Brown, M. Hartnett, & T. Stewart (Eds.), Future challenges, sustainable futures. Proceedings ascilite Wellington 2012 (pp. 560–564).
Possibly revising 2 pages. Mor, Y., Ferguson, R., & Wasson, B. (2015). Editorial: Learning design, teacher inquiry into student learning and learning analytics: A call for action. British Journal of Educational Technology, 46(2), 221–229. https://doi.org/10.1111/bjet.12273
Prinsloo, Paul, & Slade, Sharon. (2017). Ethics and learning analytics: Charting the (Un)Charted. In Handbook of Learning Analytics (pp. 49–57). Society for Learning Analytics Research. Retrieved from https://solaresearch.org/hla-17/hla17-chapter4/
Sergis, S., & Sampson, D. G. (2017). Teaching and Learning Analytics to Support Teacher Inquiry: A Systematic Literature Review. In Learning Analytics: Fundamentals, Applications, and Trends (pp. 25–63). Springer, Cham. https://doi.org/10.1007/978-3-319-52977-6_2
Siemens, George, & Baker, Ryan. (2012). Learning analytics and educational data mining: towards communication and collaboration. In Proceedings of the 2nd International Conference on Learning Analytics and Knowledge (pp. 252–254).
Ullmann, T. D., Wild, F., & Scott, P. (2012). Comparing Automatically Detected Reflective Texts with Human Judgements. In 2nd Workshop on Awareness and Reflection in Technology-Enhanced Learning. 7th European Conference on Technology-Enhanced Learning (pp. 101–116). Retrieved from http://ceur-ws.org/Vol-931/paper8.pdf
Example learning analytics
Table of Contents
- Overview of Week 4
- Experiencing - Example learning analytics
- Examining - Your experience with learning analytics: As teacher and student
- Explaining - What is learning analytics and what might it be good for?
- Applying - How might I apply learning analytics? Should I?
1. Introduction
Have you heard the term learning analytics used before this course? It’s become one of the major areas of interests (a fad?) within higher education over the last 10 years or so. The 2017 Horizon Report mentions learning analytics as part of its Growing Focus on Measuring Learning trend. But do you know what learning analytics is? Have you used it, or seen it used? The driving question for this week is
How might I apply learning analytics? Should I?
There are a couple of reasons why these questions are relevant to you. First, learning analytics is a strongly emerging practice in higher education. Being more aware of what it is and how (and if) it might be used is important for a tertiary educator. Second, as you’ve hopefully seen so far, Mor et al (2015) and others position learning analytics as part of a “virtuous circle” (p. 221) with learning design and teacher inquiry into student learning.
Some real life examples
In the experiencing stage of this week’s learning path you will engage with two examples of how learning analytics have been used by tertiary educators. These two examples are:
-
Video of a Hazel Jones - an Educational Designer and PhD student - talking about how she’s helped tertiary educators use learning analytics across a number of universities.
-
An exploration of what learning analytics suggests about learner activity in this course.
2. Hazel's experiences with learning analytics
Hazel Jones is an educational designer and PhD candidate at USQ. Hazel has a history of working in Australian Higher Education supporting tertiary educators, including with the use of learning analytics. This last has became a passion of Hazel’s and led to her PhD topic.
In the following video talks about her approach, thoughts and experiences of helping tertiary educators make use of learning analytics. You can watch the video all in one go (see below) or dip into the sections of the video that interest you the most.
In the video, Hazel talks about a number of topics. The following table allows you to skip to the topic that interests you. Alternatively, you could watch the video all in one go.
|
Start to 1m16s
|
How Hazel starts the learning analytics conversation with a tertiary educator
|
|
1m16s to 2m10s
|
An suggestion that there is a long history of teachers using "learning analytics". A suggestion that provides a useful metaphor for an important use of learning analytics.
|
|
2m10s to 3m07s
|
An overview of the type of questions that an educator can ask using learning analytics in an online context
|
|
3m07 to 4m49s
|
An overview of the different types of data that learning analytics might make use of.
|
|
4m49s to 9m30s
|
A description of how learning analytics is used in a large, first-year Nursing course to understand and improve student engagement with an assessable quiz
|
|
9m30s to 11m:05s
|
Introduces some of the further questions that are generated for a tertiary educator once they start using learning analytics.
|
|
11m:05s to 27m:02s
|
An explanation of how learning analytics can be used to dig deeper into what is happening.
|
Experiences with Learning Analytics from David Jones on Vimeo.
3. EDU8702 and learning analytics
The aim in the following pages is to provide you with some experience of what it feels like to be experiencing learning analytics from the learner perspective. This is done by providing a brief overview of some of the different learning analytics related services that are available within this context and how they have (or haven’t) been used.
Beyond the theoretical value (as per Kolb’s experiential cycle) of providing you with real example of the topic of conversation this week. I believe that - even a limited - experience of learning analytics as a student will provide you with a unique insight into learning analytics and I hope this will positively inform how you might make use of learning analytics in your own practice.
Exercise - Implications and reflection for your practice
The examining section of the learning path (the next section you complete) consists solely of the following exercise. Keep this exercise in mind as you watch and read the following examples of learning analytics
Reflect on the examples in light of the driving question for this week
How might I apply learning analytics? Should I?
In particular, consider the following questions, but don’t be limited to these
As a tertiary educator:
-
Have you seen or used any of these learning analytics in your practice?
-
What additional learning analytics have you seen or used?
-
Do any of the learning analytics shown here provide potential benefit to your practice?
-
What are the limitations and issues with these learning analytics?
As a student in this course:
-
How aware were you of the data being gathered by you as a student in this course?
-
Are you troubled by any of the data that is being gathered?
-
What about your participation in this course do the learning analytics shown fail to capture, or perhaps mis-represent?
-
How does the experience of having learning analytics being “done to you”, influence your thinking about how and if to use learning analytics as a tertiary educator?
3.1. Why I use learning analytics - know thy student
As outlined in this blog post, my use of learning analytics to date has been primarily driven with the aim of increasing my ability to “know thy student” and in particular to have some idea about how and if they are engaging with the course. In this way my use of learning analytics echoes the metaphor that Hazel introduced in the discussion of her practice with learning analytics.
Intellectually and through experience I have learned that the use of learning analytics described her only provide very broad indications of how students are engaging with the course. They can never capture the full richness of this practice, especially given the nature of the technology. But the available analytics do provide a small improvement.
This is especially so in a course of 300+ students. The context in which much of my current practice originated. Consequently, the value of that practice in this course with 4 students is under consideration.
3.2. Activity completion
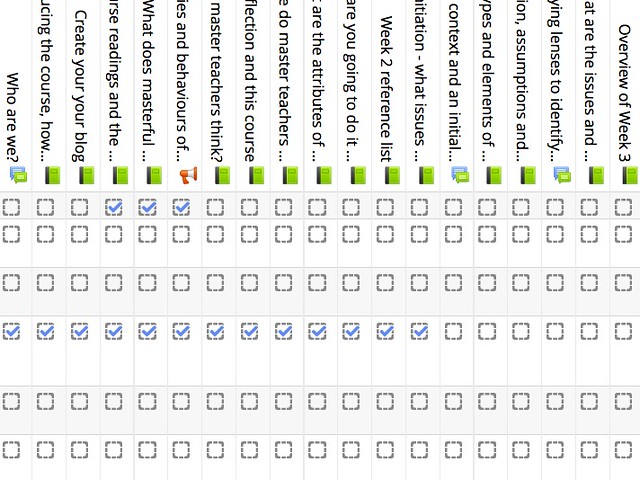
You may have noticed that each of the little boxes next to activities and resources on the course Study Desk. Depending on your progress, some of these boxes may have ticks in them. These ticks indicated that you have - according to the software - completed the activity. “Completion” typically involves visiting each of the pages in a Moodle book or posting the requested number of posts to a discussion forum.
This is a Moodle feature called Activity Completion. As part of that feature Moodle stores information about which learners have completed which tasks and provides reports that allow teaching staff to view those records. The following image shows part of the report for this course (it includes some of the teaching staff).
Activity completion - with a designed course site - can provide an indication of what students have completed and perhaps learned. In large courses, I’ve found this very useful when answering questions from students. Knowing whether they’ve accessed an activity/resource related to the question can guide the discussion with the student.
If the course activities/resources aren’t split up like this, then the value of activity completion is reduced.
3.3. Activity report
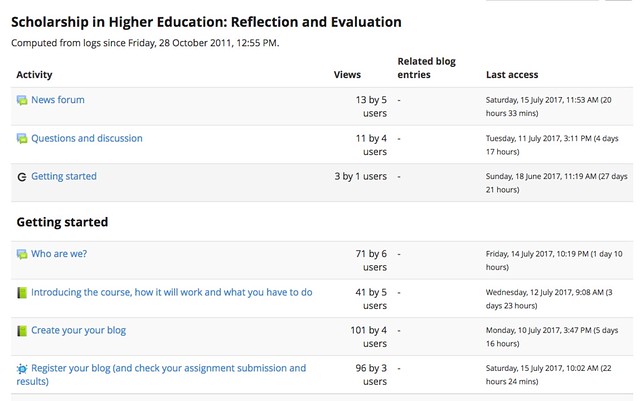
Activity completion described on the previous page captures information about activity that is at a slightly higher level of abstraction. Moodle (like most LMS systems) also provides an Activity Report. For each activity and resource within the course website, the activity report shows the number of times it has been viewed and the number of users who have viewed it. The following image shows part of the Activity Report for this course.
One of the drawbacks of this report is that it shows activity by both staff and students. This makes it difficulty - especially in this course - to understand how the students are using the resources. Another drawback is that it exists separate from the course website. Later in this book you’ll be shown another view of the same data that is more usable.
3.4. Logs and clickstreams
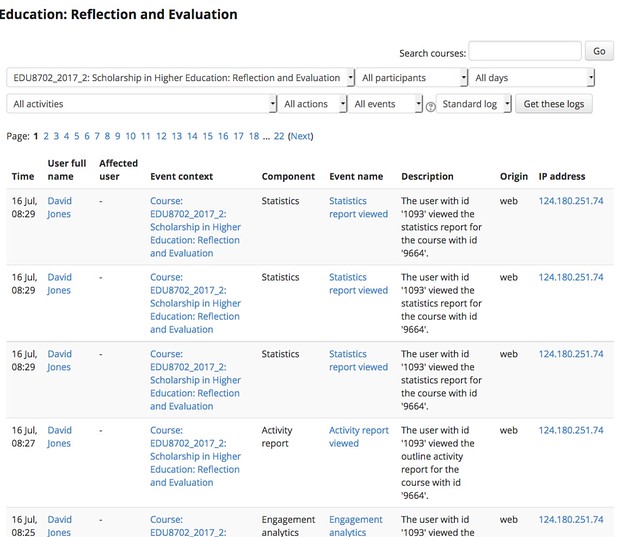
Moodle is able to generate the Activity Report because it - like all other LMS - record every click you and I make in the LMS. This is recorded in a log. This data can be called a clickstream. Moodle allows teaching staff to examine the clickstream for particular resources, activities and users. The following image shows part of the Log report from Moodle for this course showing the activities I was doing while generating the images for this book.
From this image you can gain an idea of the information recorded, which includes: who clicked on what resource/activity; the type of activity the click is associated with; when the click happened; and the IP address from which the click originated. This is not data that provides a lot of insight into learning, just when and what link has been clicked on. However, the large number of clicks that are generated in many courses become quite large, hence the use of the term big data.
The nature of this type of data - the foundation for a lot of learning analytics, but not all - troubles many people. For example, Lodge & Lewis (2012) write
The reductionist approach to what is a complex phenomenon is akin to behaviourist approaches used to understand learning in the 20th Century. Are we at risk of treating learning in a higher education context as being analogous to a rat pressing a lever? Yes as we can „measure‟ it, or no, as it does not make meaning out of complex notions such as learning in adulthood, learning for professional preparation, learning as research training, learning as development and growth, learning as being-in-the-world?
As will be shown below, I only use clickstream data to provide a broad indication of what is happening. It can provide an early indicator of potential issues or benefits. For example, if many students are clicking many times on the one explanation of a topic, this potentially suggests that the explanation is not working. What it does mean becomes a topic for further exploration.
3.5. Different representations
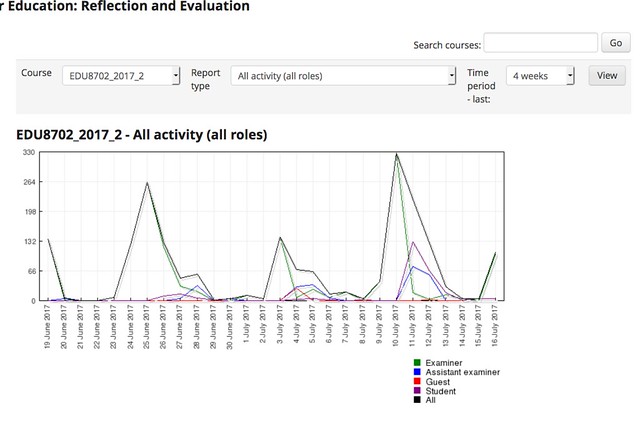
Any value from large amounts of fine-grain data of the type contained in clickstreams can be generated from different representations. Moodle provides a statistics report that provides a time-based visualisation of the information available in the activity report.
The following image shows that report for this course. This report does split activity amongst the different user roles. It allows you to see that the examiner (me) spent most of my time clicking on the site on around the 25th June, 3rd July and 10th July (Sundays and Mondays). This matches the times when I’m updating the course site with new learning paths.
I’ve never used this particular representation in my teaching practice. However, in large courses it could be useful for identifying peak times of usage. In turn, this might influence decisions about when certain learning events are scheduled.
3.6. Improving LMS activities
The generic learning analytics tools provided by LMS tend to be fairly simple (though they are improving). I rarely use those tools myself. Preferring tools that are more useful and contextually appropriate.
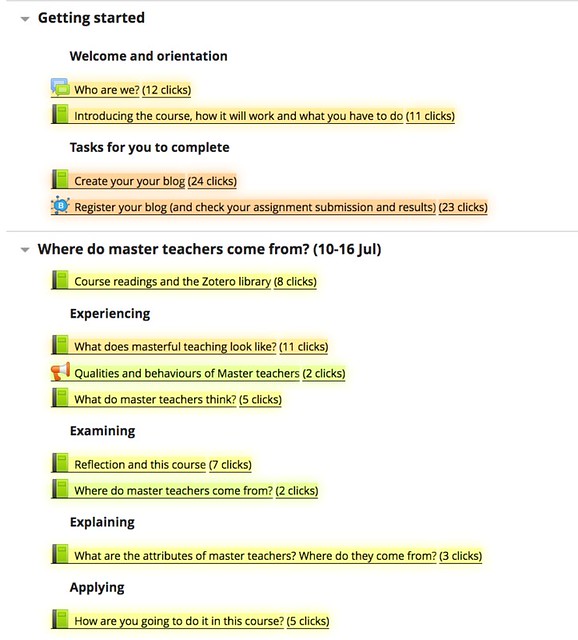
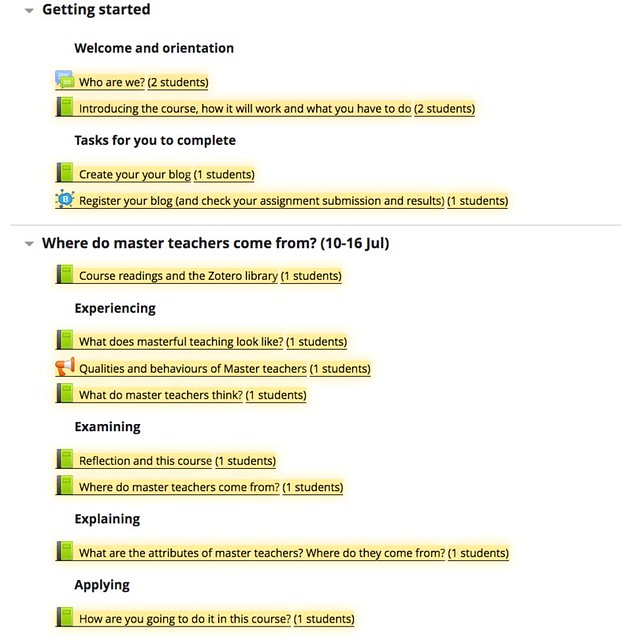
One of those tools is called the Moodle Activity Viewer (MAV). MAV was developed by a colleague of mine at CQUniversity and we’ve written about it (Jones and Clark, 2014). The following images show the course website modified by MAV to enable me to see the number of clicks or students who have accessed a particular link in Moodle. If I click on the one of the links provided by MAV, it will also show me which students have and which have not accessed an activity or resource.
MAV generates colours based on a heatmap. The redder a colour, the hotter something is meaning that more students have clicked on it. In the images below you may be able to see that the Create your blog resource and Register your blog activity are coloured using a slightly redder colour. Indicating a great level of activity.
One of the advantages of MAV is that it works on and page in Moodle. Meaning in a discussion forum it is possible to see which posts people are visiting more than others. This makes MAV very useful for gaining an understanding of how particular learning designs are working.
Clicks
Students
3.7. Analytics from outside the LMS - Videos
Analytics are not limited to LMS. All contemporary digital systems have clickstream logs, collect other data, and provide reports. The following image are of the analytics provided by Vimeo. Vimeo is the video hosting platform that is hosting the videos for EDU8702 such as the welcome video or the video of Hazel’s discussion of learning analytics used earlier in this learning path.
What this particular report shows is the number of times that the EDU8702 welcome video has been played and finished. What it shows is that one person started playing the video on the 3rd of July but did not complete the video. It shows that two people started playing the video on the 9th of July. One of these people played the video to the finish. Whether or not any of these people actually watched the video (let alone learned anything from it) can’t be known.

Your experience with learnign analytics: As teacher and student
Table of Contents
- Overview of Week 4
- Experiencing - Example learning analytics
- Examining - Your experience with learning analytics: As teacher and student
- Explaining - What is learning analytics and what might it be good for?
- Applying - How might I apply learning analytics? Should I?
1. What do you think?
The experiencing section of this learning path provided you with a small collection of examples of how learning analytics are being used by tertiary educators. One of those examples showed some of the learning analytics available for use by the teaching staff for this course.
It's time now to start some initial thinking about the driving questions for this week
How might I apply learning analytics? Should I?
In particular, to reflect on your experiences so far with learning analytics.
Your thoughts and experiences
As a tertiary educator:
-
Have you seen or used any of these learning analytics in your practice?
-
What additional learning analytics have you seen or used?
-
Do any of the learning analytics shown here provide potential benefit to your practice?
-
What are the limitations and issues with these learning analytics?
As a student in this course:
-
How aware were you of the data being gathered by you as a student in this course? What other data does USQ gather about your activities as a learner?
-
Are you troubled by any of the data that is being gathered? What about how it might be used?
-
What about your participation in this course do the learning analytics shown so far fail to capture, or perhaps misrepresent?
-
How does the experience of having learning analytics being “done to you”, influence your thinking about how and if to use learning analytics as a tertiary educator? Does it at all?
What is learning analytics and what might it be good for?
Table of Contents
- Overview of Week 4
- Experiencing - Example learning analytics
- Examining - Your experience with learning analytics: As teacher and student
- Explaining - What is learning analytics and what might it be good for?
- Applying - How might I apply learning analytics? Should I?
1. Introduction
Having looked at and reflected upon some examples of learning analytics in higher education. Focus now turns on better understanding learning analytics and its implication for tertiary educators. As an emerging practice that is potentially promises to modify some of the assumptions upon which educational practice is based, the task of understanding learning analytics is a complex one. The aim here is to give you a useful overview and introduction, rather than a complete understanding. It aims to provide a foundation upon which to build as you try to answer the driving questions for the week
How might I apply learning analytics? Should I?
Overview
This book has three main sections
- Teacher inquiry and learning analytics.
Aims to establish the link between learning analytics and teacher inquiry into student learning (a core process for this course). Asks you to map out this link with TISL and the course.
- Big data: Implications for learning and assessment.
Introduces one view of big data and the implications it holds for learning and assessment.
- Critiques of big data.
Brief discussion and some pointers to critical views of learning analytics.
2. Learning analytics and Teacher inquiry
This course is based on the assumption that teacher-led inquiry into student learning is an effective method for becoming a master teacher. In the first learning path you were introduced to the notion of teacher inquiry and the virtuous circle that it forms with learning design and learning analytics. This was largely done through reading Mor et al (2015).
Revisit Mor et al (2015) and learning analytics
It would appear timely to revisit what Mor et al (2015) had to say about learning analytics. It starts of page 223 with the paragraph starting with
The data-informed approach to teacher inquiry, a key quality of TISL, is part of a wider trend in education, towards the use of data and analytics to inform educational practice. Learning analytics are defined as
and finishes with on page 224
As you revisit, ponder the following questions
- How is learning analytics defined?
- Where did learning analytics come from?
- What are some of the uses to which learning analytics can be put?
- What are the potential benefits of learning analytics?
- What is the problem identified with learning analytics tools?
Later, Mor et al (2015) identify that "learning analytics faces considerable challenges, some of which could be addressed by a closer dialogue with learning design and TISL" (p. 225). Re-reading these few paragraphs may also be useful.
2.1. TISL steps and learning analytics
Mor et al (2015) identify benefits to the combination of learning analytics and Teacher Inquiry into Student Learning (TISL). This and the following page provide two explicit conceptualisations of how learning analytics can be combined with TISL.
Exercise - mapping LA into this course
In the week 1 learning path you were asked to map out the assessment and study schedule of this course against the TISL process being used in this course. As you examine the following conceptualisations of how learning analytics can be combined with TISL, consider updating your original map with information about how you may be able to use learning analytics at each of the stages.
Sergis and Sampson (2017)
Sergis and Sampson (2017) perform a systematic literature review of analytics to support teacher inquiry. They offer the following description of how learning analytics can contribute to TISL. (The following table has been adapted from the original to use the 7 step TISL process being used in this course).
|
1. Initiation
|
Teaching analytics can be used to capture and analyse the educational design and facilitate the teacher to:
-
pinpoint the specific elements of their educational design that relate to the problem they have identified, and
-
Elaborate on their inquiry question by defining explicitly the educational design elements they will monitor and investigate in their inquiry
|
|
2. Context analysis or investigation
|
|
3. Formulate design objective & research question(s)
|
|
4. Design of the methods to achieve design objective & answer research question(s)
|
|
5. Enactment
|
Learning analytics can be used to collect the learner/teacher educational data that have been defined to answer their inquiry question
|
|
6. Evaluation
|
Learning analytics can be used to analyse and report on the collected data and facilitate sense-making
|
|
7. Reflection & re-design
|
The combined use of TLA can be used to answer the inquiry questions and support reflection on educational design and delivery.
|
2.2. TISL and learning analytics
Emin-Martinez et al (2014) offer the following table (p. 8) that maps what learning analytics provides and what it requires against each of the steps of the TISL model.
| Insights that trigger teachers to change practice |
Initiation |
Data from previous analysis |
| Partial image of context based on historical or related data |
Context analysis or investigation |
Historical data from the context or related data (comparing with similar situations or contexts) |
| Systematic way of organizing data |
|
Context model, normalizing the data to be analyzed |
|
Formulation of the design objective and the research question |
- Constrained formulation of the design and the research question.
- Connections to be established between them
|
- Suggestions in the decision-making process (e.g., providing info about tools that may offer data for the analysis)
- Support for comparing the research questions with the design: may the current design answer the question(s)? (if not, iterate)
|
Design of the method to achieve the learning objectives and to answer the research question(s) |
- Collection of information about available data sources/tools (capabilities/affordances regarding monitoring purposes)
- Identification of the assumptions /constraints to be verified
- Comparison of information needs of assumptions/constraints/ probable outputs and the data sources
- Input and output integration
|
- Real-time monitoring of the learning situation
- Detection of critical situations
- Visual representations of the results
- Suggestions about ways of regulating the situation (for the teacher or for the students – for self-regulated learning)
|
Enactment |
- Collection and integration of data from the different sources
- Comparison with assumptions/ constraints
- Generation of visualizations
- Feedback to teacher based on previous regulation actions
- Documentation of teacher regulation of actions and changes (e.g. to take them into account in future)
|
|
Evaluation |
- Interpretation of the data gathered (questions, learning objectives, assumptions, constraints, indicators)
- Extrapolation of trends
- Correlation of results with external data sources
|
- Trend analysis
- Results (the data monitored, the documentation collected and the evaluation) connected with the research questions
|
Reflection and Re-Design |
|
3. Big data: Implications for learning and assessment
Cope and Kalzantis (2016) use student writing as the lens to examine big data and the implications it has for learning and assessment. The next few pages will scaffold you through reading part of this article. The intent being to provide you with a broader abstract conceptualisation of what learning analytics may be and what it holds for learning, teaching and assessment.
Read pages 1 & 2 up until the section Evidence of Learning in Computer-Mediated Learning Environments.
Questions to consider as you read
3.1. Learning analytics and educational data mining
C&K identify learning analytics and educational data mining as two new sub-disciplines in education dealing with big data and suggest that two “overlap considerably” (p. 2) and combine them into the term “education data science”. Siemens and Baker (2012) suggest that the two are “connected, but distinct, research disciplines” and offer the following table to distinguish between the two.
Rather than nitpick the difference, the purpose of including this table (Siemens and Baker, 2012, p. 253) is to provide an overview of the two different disciplines, their origins, interests and approaches.
|
Discovery
|
Leveraging human judgement is key; automated discovery is a tool to accomplish this goal
|
Automated discovery is key; leveraging human judgement is a tool to accomplish this goal
|
|
Reduction & Holism
|
Stronger emphasis on understanding systems as wholes, in their full complexity
|
Stronger emphasis on reducing to components and analysing individual components and relationships between them
|
|
Origins
|
Stronger origins in semantic web, "intelligent curriculum", outcome prediction and systemic interventions
|
Strong origins in educational software and student modeling, with a significant community in predicting course outcomes
|
|
Adaptation & Personalisation
|
Greater focus on informing and empowering instructors and learners
|
Greater focus on automated adaptation (e.g. by the computer with no human in the loop)
|
|
Techniques & methods
|
Social network analysis, sentiment analysis, influence analytics, discourse analytics, learner success prediction, concept analysis, sensemaking models
|
Classification, clustering, Bayesian modeling, relationship mining, discovery with models, visualisation
|
3.2. Three educational data sources
In the next section, Cope and Kalantzis (2016) seek to classify the sources of evidence of learning that are available in digital learning environments. This overview provides a useful lens for understanding different types of learning analytics.
For example, you could use this lens for analysing the example uses of learning analytics introduced in the experiencing section of this learning path. If you did, you would find that all of these example learning analytics fit within just one of the types of educational data source identified by Cope and Kalantzis (2016). Suggesting that my current practice is only scratching the surface of the possibilities raised by learning analytics.
This blog post from 2013 outlines some initial thinking behind the integration of a learning journal assessment item into an undergraduate course that I (David) taught. It includes the following thought about future work
Explore and integrate the work of Ullman et al (2012) in automatically detecting reflective texts.
This is the same Ullman et al (2012) introduced earlier in this course in the context of elements of reflection. Ullman and his colleagues identified the elements of reflection as part of an attempt to develop a machine learning process to automatically detect reflective texts. An example the Structured, embedded data type of educational data source identified by Cope and Kalzntzis (2016).
Read the section Evidence of Learning in Computer-Mediated Learning Environments (Cope & Kalantzis, 2016 pp. 2-6)
As you read through this section are you able to provide examples of the three educational data sources introduced relevant to your discipline or experience? Which of these types of educational data source might apply to your discipline or context? Which might not?
For example, the discussion about significantly automating aspects of peer review would likely not work in this course given its current quite small number of students.
3.3. Putting big data to work
So what? How might the types of educational data sources identified by Cope & Kalantzis (2016) be applied to learning and assessment? Cope & Kalantzis (2016) suggest that big data enables significant changes to assessment and learning.
Read the section Putting big data evidence to work in learning and assessment from Cope & Kalantis (2016, pp. 6-8).
As you read, consider the following questions
-
What explanation do Cope & Kalantzis (2016) provide for why big data is big? What consequences or implications does this have?
-
If you mapped your assessment practice (or assessment practice in this course) using Table 2 from Cope & Kalantzis (2016), what would it look like?
-
Are any of these changes described by Cope & Kalantzis (2016) likely to provide significant benefit to teaching and learning in your discipline?
4. Critiques of learning analytics
As mentioned earlier it is important not to accept emerging practices at face value. It is important to question and evaluate. This book provides some pointers to a sample of the critical views of learning analytics and related notions. A taste and some pointers for further exploration.
Kop, Fournier, & Durand (2017) provide a more detailed and specific critical perspective on learning analytics. In particular, they identify questions “about truth, control, transparency, and power in big data studies” along with “inherent fallacies and biases” and “methodological concerns related to data cleaning, data selection and interpretation” (Kop et al, 2017, p. 324).
4.1. 6 provocations for big data
boyd and Crawford (2012) offer six provocations for big data in their article Critical Questions for Big Data. They examine big data in a much broader context than just higher education. However, those six provocations do provide useful prompts for thinking about learning analytics in higher education. The six provocations are
-
Big data changes the definition of knowledge.
For some big data represents a transformative shift in knowledge and knowing. A claim that is still questionable, especially if it is seen as excluding existing perspectives and practices of the same. While the new perspective may offer useful insights, it too will have its own limitations and issues.
-
Claims to objectivity and accuracy are misleading
-
Bigger data are not always better data.
Having huge amounts of data does not there are no bias or other issues hidden with the data and its interpretation.
-
Taken out of context, Big Data loses its meaning.
There’s a limited to generalisability of learning analytics. Gašević et al (2015) identify how “lack of attention to instructional conditions can lead to an over or under estimation” of the value of learning analytics.
-
Just because it is accessible does not make it ethical.
What is ethical use of data in learning analytics in higher education? Prinsloo, Paul & Slade, Sharon (2017) provide some insights into current thinking about this question.
-
Limited access to Big Data creates new digital divides.
Who has the resourcing and skills to harness big data? How does this restrict access and involvement?
4.2. Stating the obvious
An example of some of the potential issues arising from the 6 provocations and learning analytics is provided in this blog post (the whole blog post is restricted by a registration requirement, for this reason I don’t expect you to read the whole post, but feel free to do so).
The blog post reports on a number of “big data” research studies into learning from Khan Academy, Udacity/San Jose State University, and Google Course Builder (e.g. this study). The common theme from these studies is summarised in this quote from the Google Course Builder study.
our research indicates that learners who complete activities are more likely to complete the course than peers who completed no activities
This does seem to be a rather obvious conclusion. Justin Reich seems to think so given the scathing assessment of the research he gives in the blog post. It leads him to suggest Reich’s law
students who do stuff in a MOOC or other online learning environment will, on average, do more stuff than those who don't do stuff, and students who do stuff will perform better on stuff than those who don't do stuff.
And suggest it is so well established, that no further research (big data or otherwise) is required.
How might I apply learning analytics? Should I?
Table of Contents
- Overview of Week 4
- Experiencing - Example learning analytics
- Examining - Your experience with learning analytics: As teacher and student
- Explaining - What is learning analytics and what might it be good for?
- Applying - How might I apply learning analytics? Should I?
1. How might you?
This learning path has been designed to help you answer this week’s driving questions
How might I apply learning analytics? Should I?
It’s now time for you to explicitly think about answer these questions. At least in terms of the assessment for this course.
Potentially, learning analytics might be useful in at least the following assignment components.
-
Assignment 1, Part B - How can I evaluate a learning and teaching episode?
As shown in the page linking learning analytics and teacher inquiry, applications of learning analytics may help you analyse and evaluate a past learning and teaching episode.
-
Assignment 2, Part B - How do I plan to implement and evaluate my chosen emerging practice?
Similarly, learning analytics may become an important component of your plan to design and evaluate your emerging practice.
-
Assignment 2, Part C - How will I become a master teacher?
Lastly, analytics could become a useful tool to help you continue your journey toward being a master teacher.
But there’s no need to examine all those right now. A more immediate focus are the driving questions for this week.
Thinking of your discipline and your context, how might you apply learning analytics? Should you?
How have learning analytics been used in your discipline and your context? Which of the types of source of educational evidence from Cope and Kalantzis (2016) do they use? What is the view of learning analytics in the teaching of your discipline? What are the issues, challenges and opportunities? How does learning analytics fit in the literature for your discipline?
How might the practice of learning analytics in your discipline fit with the mapping between learning analytics, TISL and this course you made earlier in this learning path? What might this mapping mean for what you will be doing over coming weeks?