Normal (Gaussian) distribution#
See also: teaching-mathematics
Why it seems everywhere and why under closer inspection it is almost nowhere.#
Normal distribution is based on the assumption that
- all individual variables have finite variance; and
- they are independent.
A thread by @filippie509 on Thread Reader App - Clipped on Tuesday, May 2, 2023, 9:16 AM
A little thread on how Gaussian (aka Normal) distribution arises, why it seems to be everywhere and why under closer inspection it is almost nowhere. Jump in👇 
Gaussian distribution is so prevalent, because it arises as a limit of averaging out many independent random variables with finite variance. This fundamental law of statistics is called a Central Limit Theorem or CLT. en.wikipedia.org/wiki/Central_l… 
This can be very well seen in a little simulation below: 200x400 grid (so 80000) independent random variables with uniform distribution (-0.5,0.5) are simulated and a histogram of averages are taken and plotted below, clearly showing bell curve as expected.
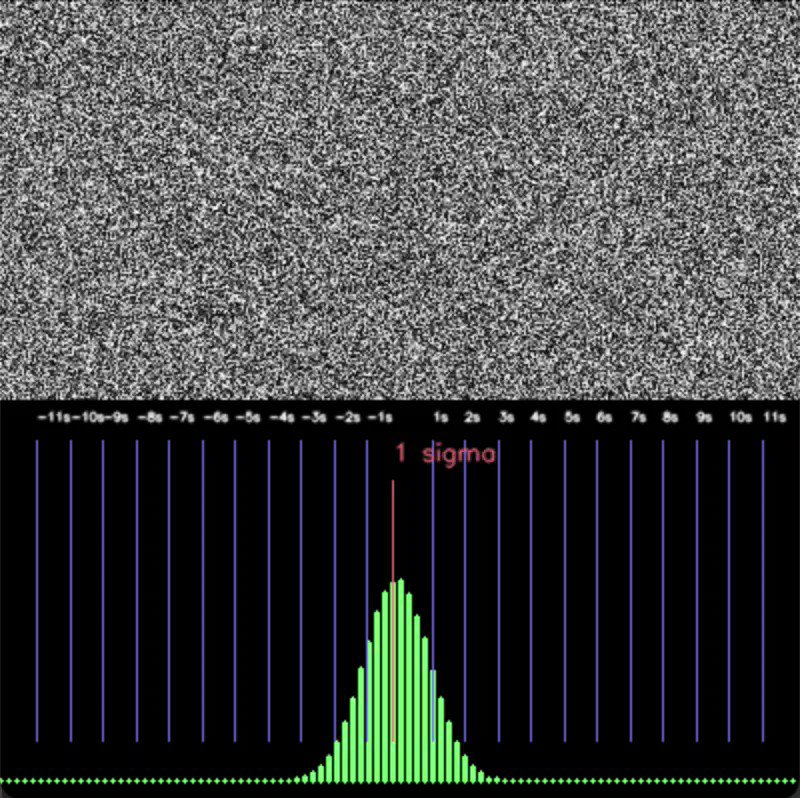
So we are done now? What else is there to say? Well... there are two main assumptions of CLT. First that all individual variables have finite variance. And that is most of the time the case. But second that they are independent. And that is when things are a little complicated.
Because when there is even tiny bit of dependence introduced in these variables, CLT falls apart. I simulate this below by adding a small bias to all the random cells, nothing even noticeable by eye. But suddenly the averages explode into the tail of distribution:
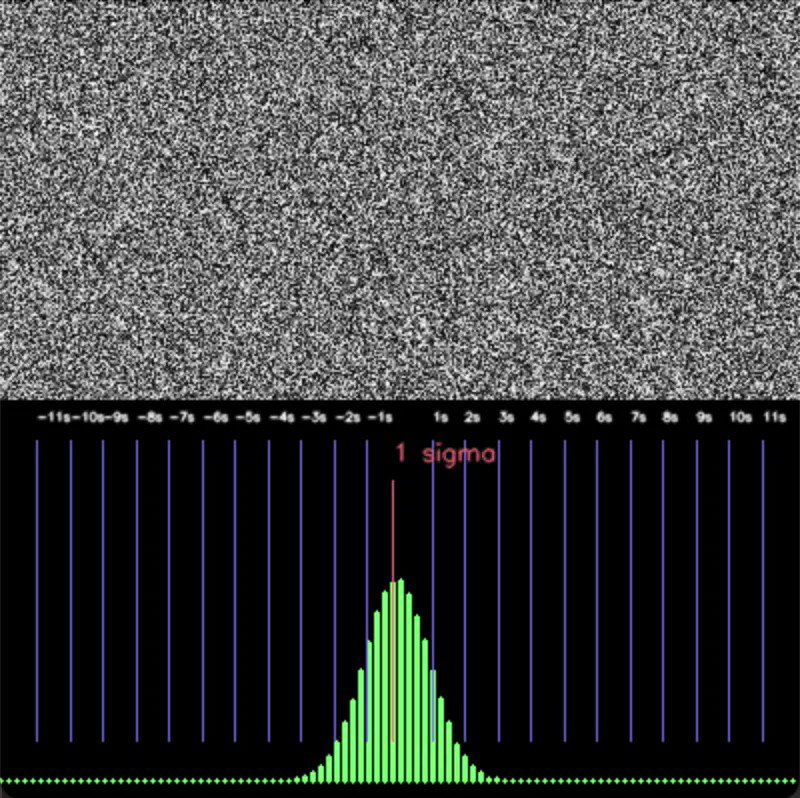
6 sigma, 10 sigma, 13 sigma these events should pretty much be impossible under normal distribution. A 10-Sigma would be an event that happens once every 5.249e+020 years (that's half a Septillion). But of course with slight dependence the mean of these vars is no longer Gaussian
And that often happens in real world - here everything is pretty much always slightly dependent. But often that dependence is so weak, CLT still works, and statisticians are happy, models work, and everything is great. But every now and then things suddenly get dependent.
E.g. in stock market, an index is a combination of individual stocks whose prices are mostly independent and so often behaves like a gaussian random walk. Until of course an event occurs that affects all these companies and suddenly they are dependent and you see a 10 sigma jump.
This should be taught in every statistics class as literally the first thing after CLT. But often isn't. And hence people misuse statistics and apply wrong models to complex data. Read more from @nntaleb who was an inspiration for this little thread.
BTW: Here is the code snippet I wrote to generate these animations if you want to fiddle with it github.com/piekniewski/ra…